Audiobook Learning Companion
The figures and tables from the book, in full. Pinch to zoom, scroll the wide tables sideways, or download the whole set as a PDF.
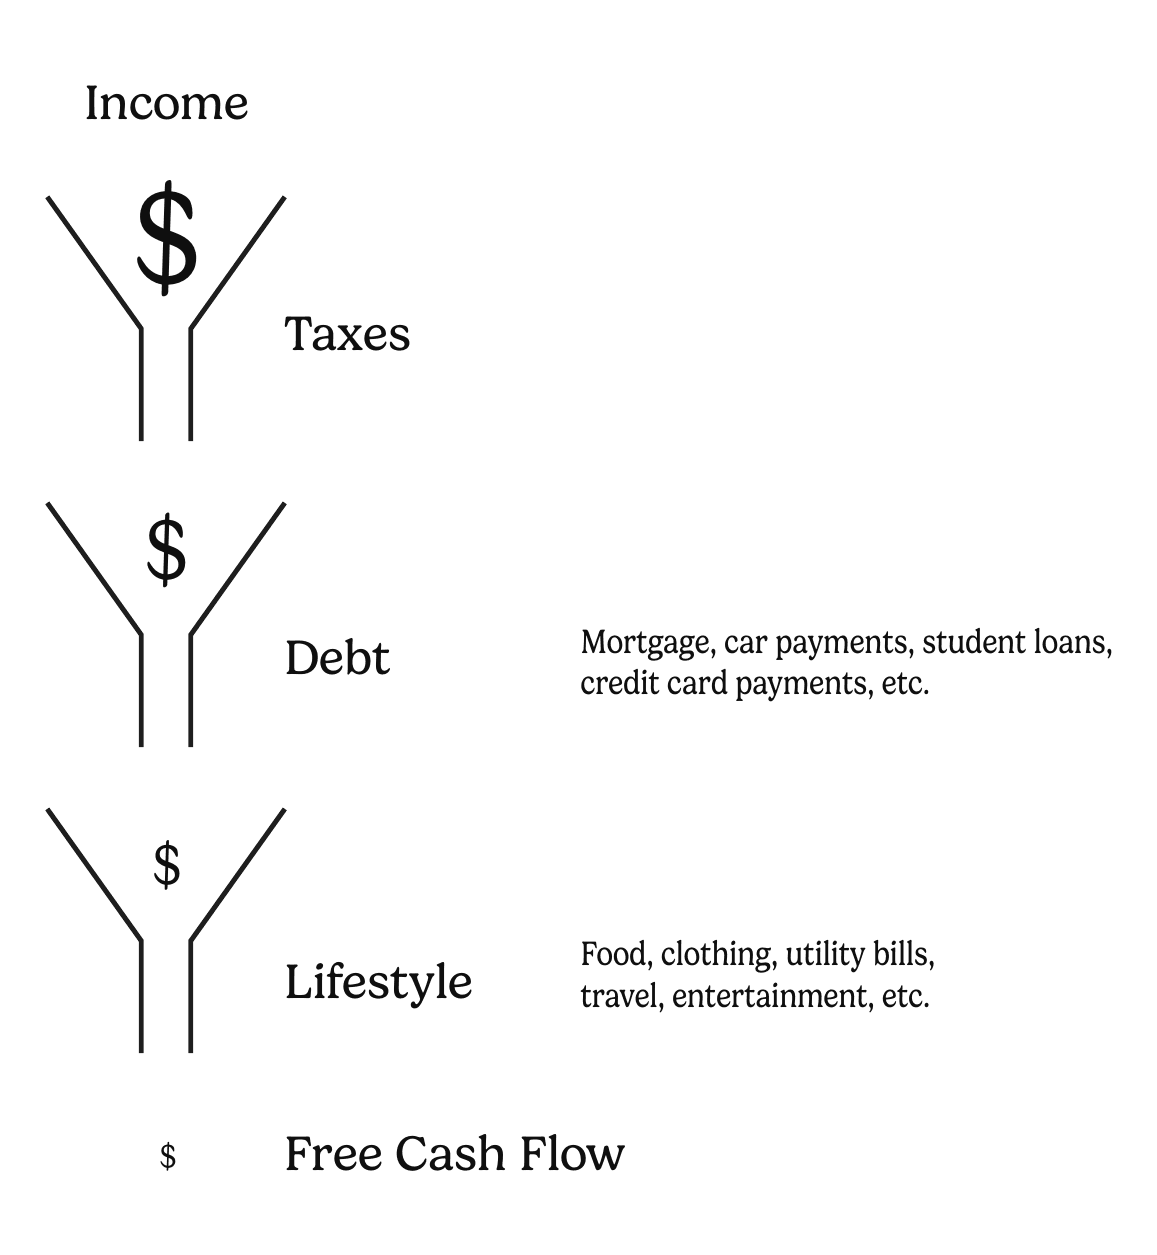
The Cash Flow Funnels
How people normally think about cash flow and saving.
Chapter 3, page 55
The Power of Compounding
Saving now versus later.
Chapter 5, page 77, 7% assumed rate of return
| The Go-Getter | The Slowpoke | |||
|---|---|---|---|---|
| Year | Contribution | Wealth | Contribution | Wealth |
| 1 | $5,500 | $5,885 | $0 | $0 |
| 2 | $5,500 | $12,182 | $0 | $0 |
| 3 | $5,500 | $18,920 | $0 | $0 |
| 4 | $5,500 | $26,129 | $0 | $0 |
| 5 | $5,500 | $33,843 | $0 | $0 |
| 6 | $5,500 | $42,097 | $0 | $0 |
| 7 | $5,500 | $50,929 | $0 | $0 |
| 8 | $5,500 | $60,379 | $0 | $0 |
| 9 | $5,500 | $70,490 | $0 | $0 |
| 10 | $5,500 | $81,310 | $0 | $0 |
| 11 | $0 | $87,001 | $5,500 | $5,885 |
| 12 | $0 | $93,092 | $5,500 | $12,182 |
| 13 | $0 | $99,608 | $5,500 | $18,920 |
| 14 | $0 | $106,581 | $5,500 | $26,129 |
| 15 | $0 | $114,041 | $5,500 | $33,843 |
| 16 | $0 | $122,024 | $5,500 | $42,097 |
| 17 | $0 | $130,566 | $5,500 | $50,929 |
| 18 | $0 | $139,705 | $5,500 | $60,379 |
| 19 | $0 | $149,485 | $5,500 | $70,490 |
| 20 | $0 | $159,949 | $5,500 | $81,310 |
| 21 | $0 | $171,145 | $5,500 | $92,886 |
| 22 | $0 | $183,125 | $5,500 | $105,274 |
| 23 | $0 | $195,944 | $5,500 | $118,528 |
| 24 | $0 | $209,660 | $5,500 | $132,710 |
| 25 | $0 | $224,336 | $5,500 | $147,884 |
| 26 | $0 | $240,040 | $5,500 | $164,121 |
| 27 | $0 | $256,843 | $5,500 | $181,495 |
| 28 | $0 | $274,822 | $5,500 | $200,084 |
| 29 | $0 | $294,059 | $5,500 | $219,975 |
| 30 | $0 | $314,643 | $5,500 | $241,258 |
| 31 | $0 | $336,668 | $5,500 | $264,032 |
| 32 | $0 | $360,235 | $5,500 | $288,399 |
| 33 | $0 | $385,452 | $5,500 | $314,472 |
| 34 | $0 | $412,433 | $5,500 | $342,370 |
| 35 | $0 | $441,303 | $5,500 | $372,221 |
| 36 | $0 | $472,195 | $5,500 | $404,161 |
| 37 | $0 | $505,248 | $5,500 | $438,337 |
| 38 | $0 | $540,616 | $5,500 | $474,906 |
| 39 | $0 | $578,459 | $5,500 | $514,034 |
| 40 | $0 | $618,951 | $5,500 | $555,902 |
| 41 | $0 | $662,277 | $5,500 | $600,700 |
| 42 | $0 | $708,637 | $5,500 | $648,634 |
| 43 | $0 | $758,241 | $5,500 | $699,923 |
| Total | $55,000 | $181,500 | ||
The Go-Getter saves for the first ten years and then stops. The Slowpoke waits ten years, then saves for the next thirty-three. The Slowpoke puts in more than three times as much money — $181,500 against $55,000 — and still ends up behind.
The Power of Compounding
Saving now versus later - saving big.
Chapter 5, page 80, 7% assumed rate of return
| The Go-Getter | The Slowpoke | |||
|---|---|---|---|---|
| Savings $100,000/year from year 1 | Savings $100,000/year from year 11 | |||
| Year | Contribution | Wealth | Contribution | Wealth |
| 1 | $100,000 | $107,000 | $0 | $0 |
| 2 | $100,000 | $221,490 | $0 | $0 |
| 3 | $100,000 | $343,994 | $0 | $0 |
| 4 | $100,000 | $475,074 | $0 | $0 |
| 5 | $100,000 | $615,329 | $0 | $0 |
| 6 | $100,000 | $765,402 | $0 | $0 |
| 7 | $100,000 | $925,980 | $0 | $0 |
| 8 | $100,000 | $1,097,799 | $0 | $0 |
| 9 | $100,000 | $1,281,645 | $0 | $0 |
| 10 | $100,000 | $1,478,360 | $0 | $0 |
| 11 | $100,000 | $1,688,845 | $100,000 | $107,000 |
| 12 | $100,000 | $1,914,064 | $100,000 | $221,490 |
| 13 | $100,000 | $2,155,049 | $100,000 | $343,994 |
| 14 | $100,000 | $2,412,902 | $100,000 | $475,074 |
| 15 | $100,000 | $2,688,805 | $100,000 | $615,329 |
| 16 | $100,000 | $2,984,022 | $100,000 | $765,402 |
| 17 | $100,000 | $3,299,903 | $100,000 | $925,980 |
| 18 | $100,000 | $3,637,896 | $100,000 | $1,097,799 |
| 19 | $100,000 | $3,999,549 | $100,000 | $1,281,645 |
| 20 | $100,000 | $4,386,518 | $100,000 | $1,478,360 |
| 21 | $100,000 | $4,800,574 | $100,000 | $1,688,845 |
| 22 | $100,000 | $5,243,614 | $100,000 | $1,914,064 |
| 23 | $100,000 | $5,717,667 | $100,000 | $2,155,049 |
| 24 | $100,000 | $6,224,904 | $100,000 | $2,412,902 |
| 25 | $100,000 | $6,767,647 | $100,000 | $2,688,805 |
| 26 | $100,000 | $7,348,382 | $100,000 | $2,984,022 |
| 27 | $100,000 | $7,969,769 | $100,000 | $3,299,903 |
| 28 | $100,000 | $8,634,653 | $100,000 | $3,637,896 |
| 29 | $100,000 | $9,346,079 | $100,000 | $3,999,549 |
| 30 | $100,000 | $10,107,304 | $100,000 | $4,386,518 |
| 31 | $100,000 | $10,921,815 | $100,000 | $4,800,574 |
| 32 | $100,000 | $11,793,343 | $100,000 | $5,243,614 |
| 33 | $100,000 | $12,725,876 | $100,000 | $5,717,667 |
| 34 | $100,000 | $13,723,688 | $100,000 | $6,224,904 |
| 35 | $100,000 | $14,791,346 | $100,000 | $6,767,647 |
| 36 | $100,000 | $15,933,740 | $100,000 | $7,348,382 |
| 37 | $100,000 | $17,156,102 | $100,000 | $7,969,769 |
| 38 | $100,000 | $18,464,029 | $100,000 | $8,634,653 |
| 39 | $100,000 | $19,863,511 | $100,000 | $9,346,079 |
| 40 | $100,000 | $21,360,957 | $100,000 | $10,107,304 |
| 41 | $100,000 | $22,963,224 | $100,000 | $10,921,815 |
| 42 | $100,000 | $24,677,650 | $100,000 | $11,793,343 |
| 43 | $100,000 | $26,512,085 | $100,000 | $12,725,876 |
| Total | $4,300,000 | $3,300,000 | ||
Here both savers keep going for the full forty-three years. The Slowpoke never catches up, and the gap keeps widening.
Two-thirds of the Time, one-third of the Dollars
Chapter 5, page 82
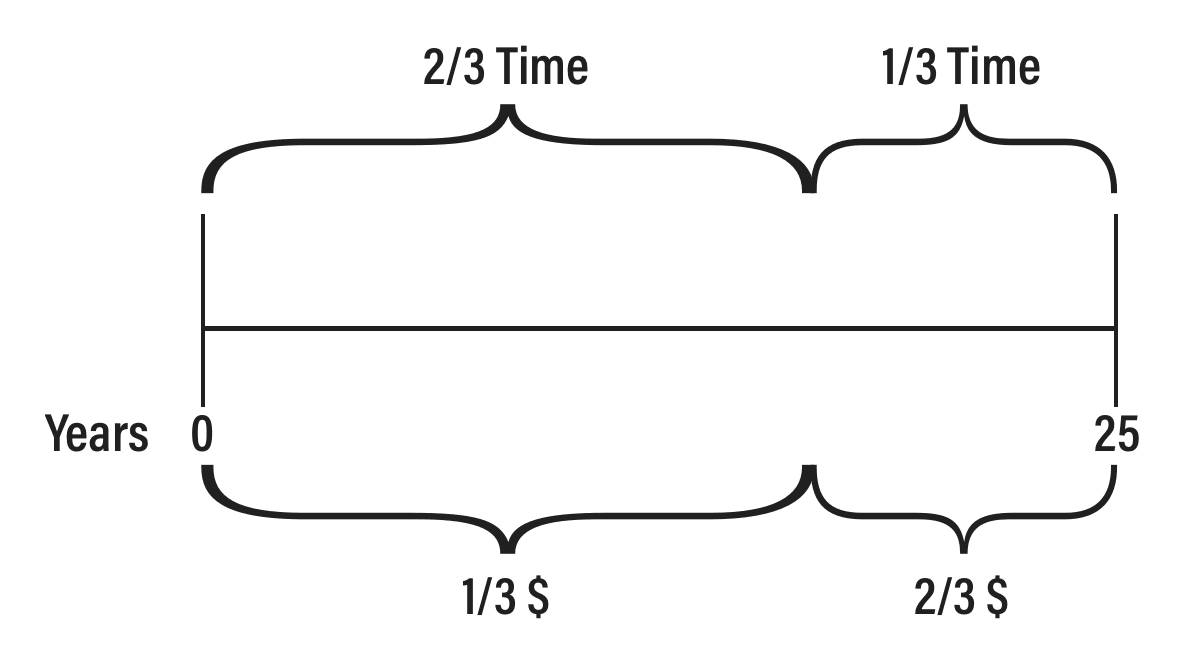
The first two-thirds of the time period, you only accumulate one-third of the dollars of wealth you need. The last one-third of the time, you accumulate two-thirds of the wealth you need.
The Geometric Jump
Chapter 5, page 83
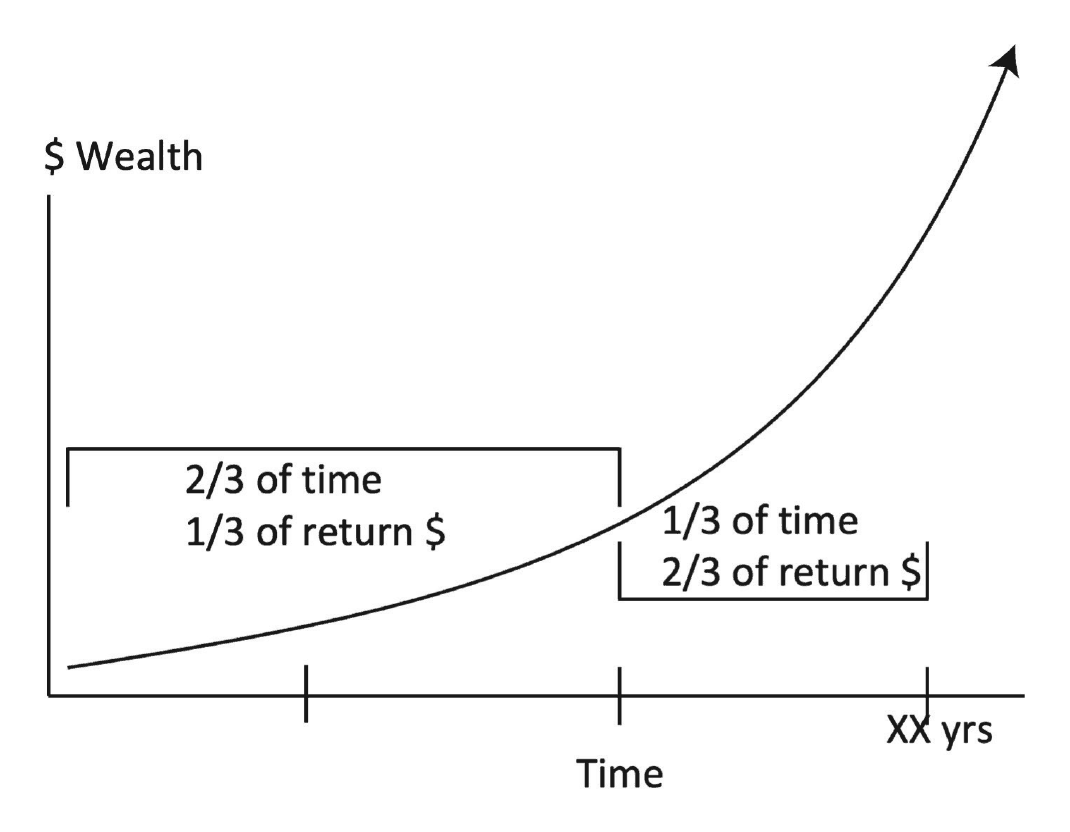
If you have saved faithfully, the "magic" of compounding occurs in the last one-third of the time, generating two-thirds of the returns.
Tax Savings Savings Effect
(Or how to turn $3,000 into $5,000 without working harder.)
Chapter 6, page 91 · 40% assumed tax bracket
| Amount | Tax rate | Tax owed |
|---|---|---|
| $3,000 | 40% | $1,200 |
| $1,200 | 40% | $480 |
| $480 | 40% | $192 |
| $192 | 40% | $76.80 |
| $76.80 | 40% | $30.72 |
| $30.72 | 40% | $12.29 |
| $12.29 | 40% | $4.92 |
| $4.92 | 40% | $1.97 |
| $1.97 | 40% | $0.79 |
| $0.79 | 40% | $0.32 |
| $0.32 | 40% | $0.13 |
| $0.13 | 40% | $0.05 |
| $0.05 | 40% | $0.02 |
| $5,000 (rounded total) | 40% | $2,000 |
To save $3,000 outside a tax shelter, you have to earn $5,000 and pay $2,000 in income taxes. Shelter it instead — in a 401(k), say — and you can run the same cascade in reverse.
Leveraging the equity in your home to create investable cash
Take out a $250,000 mortgage at 4 percent, invest it for returns of 7 percent.
Chapter 6, page 98
| CASH IN | |
| Income earned from investing | $17,500 |
| Less income taxes on that income (blended capital gains and ordinary rates) | −$5,250 |
| Net income | $12,250 |
| CASH OUT | |
| 4% interest on a $250,000 mortgage | $10,000 |
| Less possible tax savings on deducting interest ($10,000 × 40%) | −$4,000 |
| Net cost | $6,000 |
| NET CASH FLOW FOUND | |
| Possible net investable cash created | $6,250 |
| If saved in a 401(k), and the tax savings saved too | $10,417 |
Sophie increased her net cash flow by $6,250 a year without working one day longer — and by more than that after tax, because she could deduct the mortgage interest.
Download the Full Set
All seven figures and tables in one PDF, formatted for printing or keeping on your mobile device.
Download the PDFGet the CakeClub app
Master Your Cash Flow explains the method. The CakeClub app runs the numbers. Find your free cash flow, put it to work, and watch compounding do the rest.
Download NowMaster Your Cash Flow: Let Them Eat Cake And Build Wealth Too!
by Al Zdenek, CPA/PFS and Amin Boroomand, PhD
Figures and tables reproduced from the book. Copyright © 2026 by Albert J. Zdenek, Jr. and Amin Boroomand.